Debug with your agent.

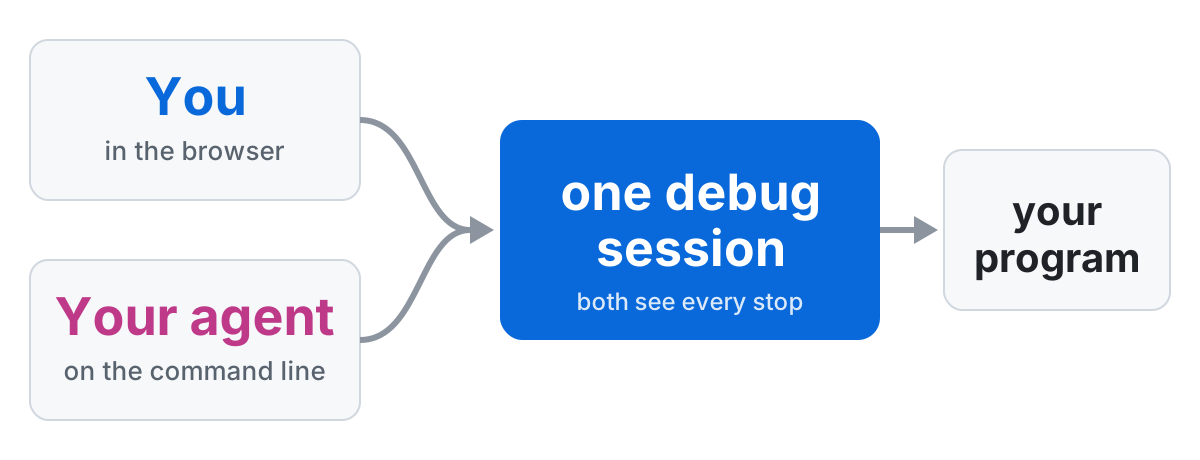
You click through a real debugger in your browser. Your AI agent drives the same session from the command line. Both of you see every stop.

curl -fsSL https://milo-language.github.io/dapweb/install.sh | sh

macOS and Linux. Read the script (it downloads the release into ./dapweb-*).
One session. Two drivers.

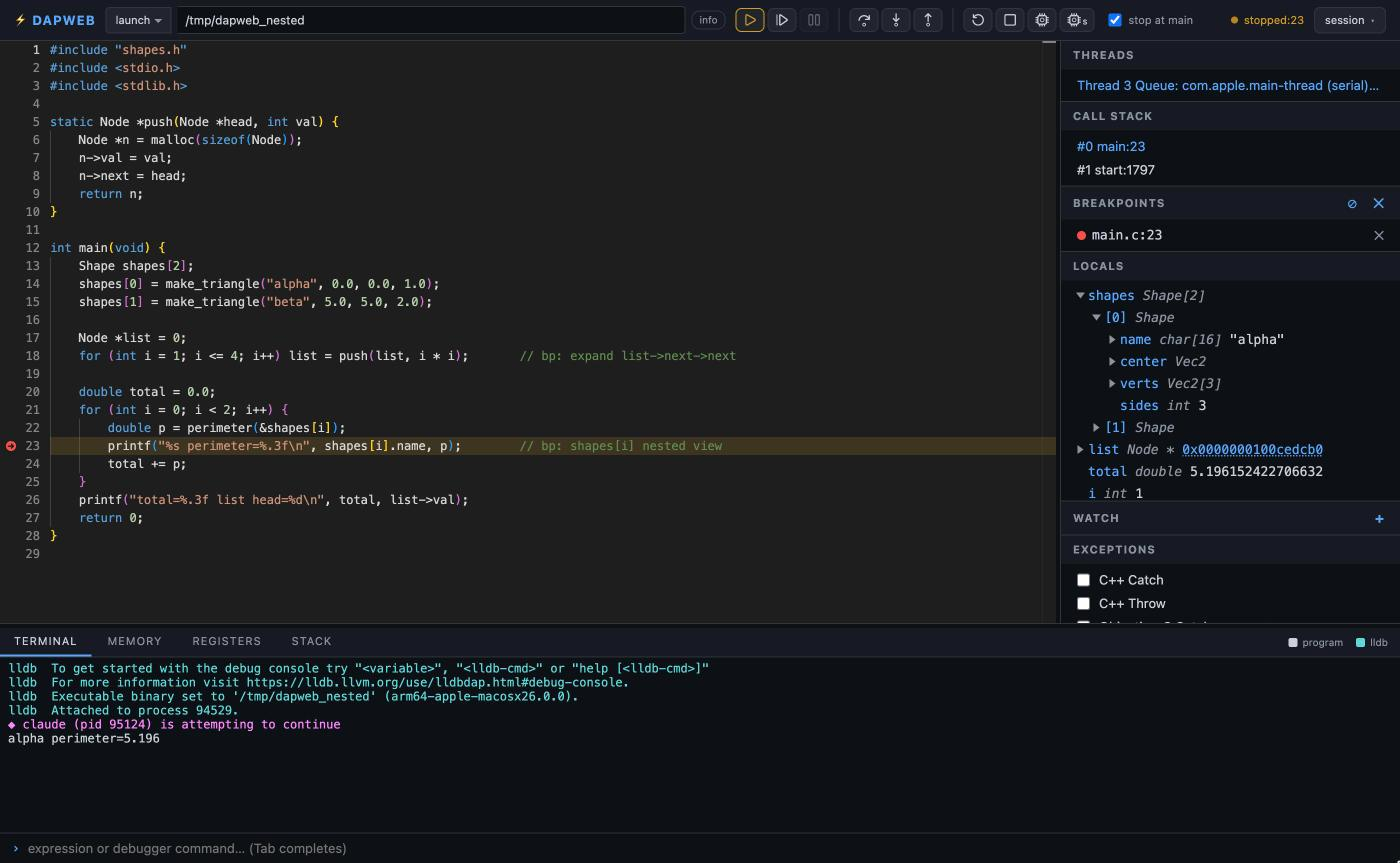
Whatever your agent does shows up in your tab as it happens. Whatever you do, your agent can read back.

You (in the browser) and your agent (on the command line) both drive one debug session, which runs your program

Any language with a debugger.

dapweb speaks the Debug Adapter Protocol, the same one VS Code uses. Nearly every debugger speaks it too.

C, C++, Rustlldb-dap
Pythondebugpy
Godelve
JS, TSjs-debug
Javajava-dap

Plus anything else with a DAP adapter: --dapPath "gdb -i dap".

A real debugger, not a toy.

Everything you expect, plus views of the machine most debuggers hide.

Agent-native CLI

Every action is a dapweb api command with a JSON reply. No plugin, no protocol to learn.

Full breakpoints

Conditions, hit counts and log points, kept across restarts.

Memory you can read

Hex dump colored by region (stack, heap, code), with your locals labeled where they live.

Registers and disassembly

What changed since the last stop, and instruction-level stepping.

Your launch.json

Reuse the VS Code launch configs you already have.

A memory of every session

Every event is journaled, so you or your agent can ask what happened last time.

Try it in thirty seconds.

curl -fsSL https://milo-language.github.io/dapweb/install.sh | sh